What we have for you here are the detailed numbers on American support for a Palestinian state (a question asked anually by Gallup) as well as surveys on the favorability of Israel compared to that of the Palestinians (asked by Gallup and pew).
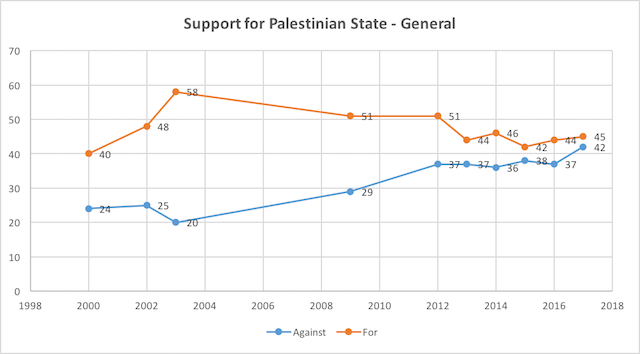
We’ll start with the general numbers on US support for a Palestinian state:
| Year | Against | For |
| 2000 | 24 | 40 |
| 2002 | 25 | 48 |
| 2003 | 20 | 58 |
| 2009 | 29 | 51 |
| 2012 | 37 | 51 |
| 2013 | 37 | 44 |
| 2014 | 36 | 46 |
| 2015 | 38 | 42 |
| 2016 | 37 | 44 |
| 2017 | 42 | 45 |
And here is the chart:
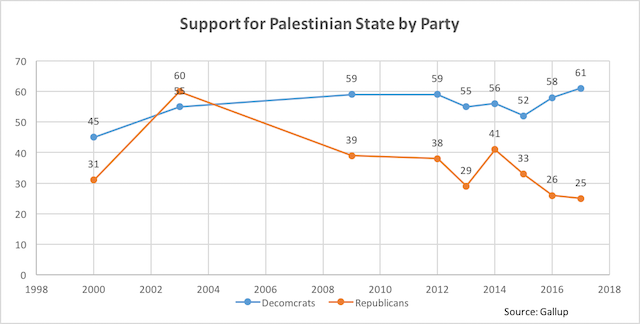
And here are the numbers on support for a Palestinian state among Democrats and Republicans:
| Year | Decomcrats | Republicans |
| 2000 | 45 | 31 |
| 2003 | 55 | 60 |
| 2009 | 59 | 39 |
| 2012 | 59 | 38 |
| 2013 | 55 | 29 |
| 2014 | 56 | 41 |
| 2015 | 52 | 33 |
| 2016 | 58 | 26 |
| 2017 | 61 | 25 |
And here’s the chart:
The Israel vs. Palestine Sympathy question
Here are the numbers from Pew. The question used by Pew is: “In the dispute between Israel and the Palestinians, which side do you sympathize with more, Israel or the Palestinians?”
[table id=4 /]
Notes:
– You can find the numbers online here (except for the gap – this is our addition).
– Pew notes that “In the 1978 Chicago Council on Foreign Relations survey conducted by the Gallup Organization, results are based on respondents who said they had “heard or read about the situation in the Middle East,” which represented 87% of the public. As a context note, in both the 1978 and 1982 CCFR/Gallup surveys, this question followed a broader question: “In the Middle East situation, are your sympathies more with Israel or more with the Arab nations?” and in 1982, a question regarding “U.S. military aid and arms sales to Israel.”
– The numbers for “neither” and for “DK/Ref are not included here. The “neither” for the last four polls was 16%, 12%, 13%, 16%.
Here’s the graph for the Pew surveys:

The numbers of Gallup refer to the question: “In the Middle East, do you sympathize more with Israel or with the Palestinians?”
[table id=5 /]
Notes:
– The dates we have here are approximate: Gallup didn’t post the exact details in recent posts, so we relied on its graph and put the year closest to the numbers shown. This should not be of much consequence.
– As you can see, the numbers for both Israel and the Palestinians are higher for Gallup, because of a different methodology of computation.
– Gallup list “both”, “neither” and “no opinion” under one category. In the last poll the number for this category was 21%.
– Gallup had more polls with this question, but we only used the ones that were listed in the recent post – see it here.
Here is the graph for the Gallup numbers:

And here is the table of gaps – Pew and Gallup side by side:
[table id=6 /]
Notes:
– To make this more friendly and understandable, we only used here the Pew polls that correspond to the dates for which we had Gallup polls. That is, we eliminated here the polls from dates for which we don’t have polls from both institutions. Naturally, this means that we have less polls here (you can see the rest of them in the separate tables above).
– When we had more than one poll for a year (for Pew) we used the one with the number closer to other polls. When we had three polls for the same year we used the number from the poll in the middle.
– As you can see here – and in the graph – the only time when there was a really big difference between the two polls was 1990. We didn’t examine the exact dates of the two polls but assume it has to do with their dates as they correspond to the first Gulf War, a time when Israel’s favorability hit the roof (hence the 57% gap in the Gallup poll that year, that quickly went down later).
Here is the graph for the gaps, which we already used on the analysis post.









 More news and opinions than at a Shabbat dinner, right in your inbox.